

Imagine walking into a bank where every single transaction is written on a public chalkboard that anyone can read. No secrets, no hidden ledgers, just raw numbers showing who sent what to whom and when. That is the foundation of on-chain analysis, which is the systematic extraction and interpretation of transactional data recorded directly on blockchain networks. While traditional finance relies on opaque quarterly reports, the blockchain offers a real-time, immutable ledger. But here is the catch: raw data is useless without context. Mining this data means turning those cryptic hexadecimal strings into actionable insights about market health, whale movements, and protocol security.
You do not need to be a computer scientist to understand why this matters. In 2026, on-chain data has moved from a niche hobbyist tool to a core component of institutional strategy. Whether you are a retail trader trying to spot the next big token or a developer monitoring network congestion, knowing how to mine and interpret this data gives you an edge that price charts alone cannot provide. Let’s break down exactly how this works, what tools you need, and where the common pitfalls lie.
Understanding the Raw Material: What Is On-Chain Data?
To mine data effectively, you first need to know what you are digging for. On-chain data consists of every interaction that occurs within a blockchain network. This includes block heights, timestamps, transaction hashes, sender and receiver addresses, transfer amounts, and gas fees. It also covers smart contract code execution and token transfers.
The key characteristic here is immutability. Once a transaction is confirmed by consensus mechanisms like Proof of Work (PoW) or Proof of Stake (PoS), it is permanent. Unlike off-chain data-which might include exchange internal balances or Lightning Network payments-on-chain records are verifiable by anyone with access to the node. For example, if you want to verify if a specific wallet holds Bitcoin, you can trace its history back to the genesis block launched in January 2009. This transparency creates a unique dataset that does not exist anywhere else in the financial world.
However, different blockchains structure this data differently. Bitcoin uses the Unspent Transaction Output (UTXO) model, which tracks coins as discrete outputs waiting to be spent. Ethereum uses an account-based model, similar to a traditional bank ledger, where accounts have balances. Understanding these architectural differences is crucial because they dictate how you extract and query the data.
The Toolkit: How to Extract and Process Blockchain Data
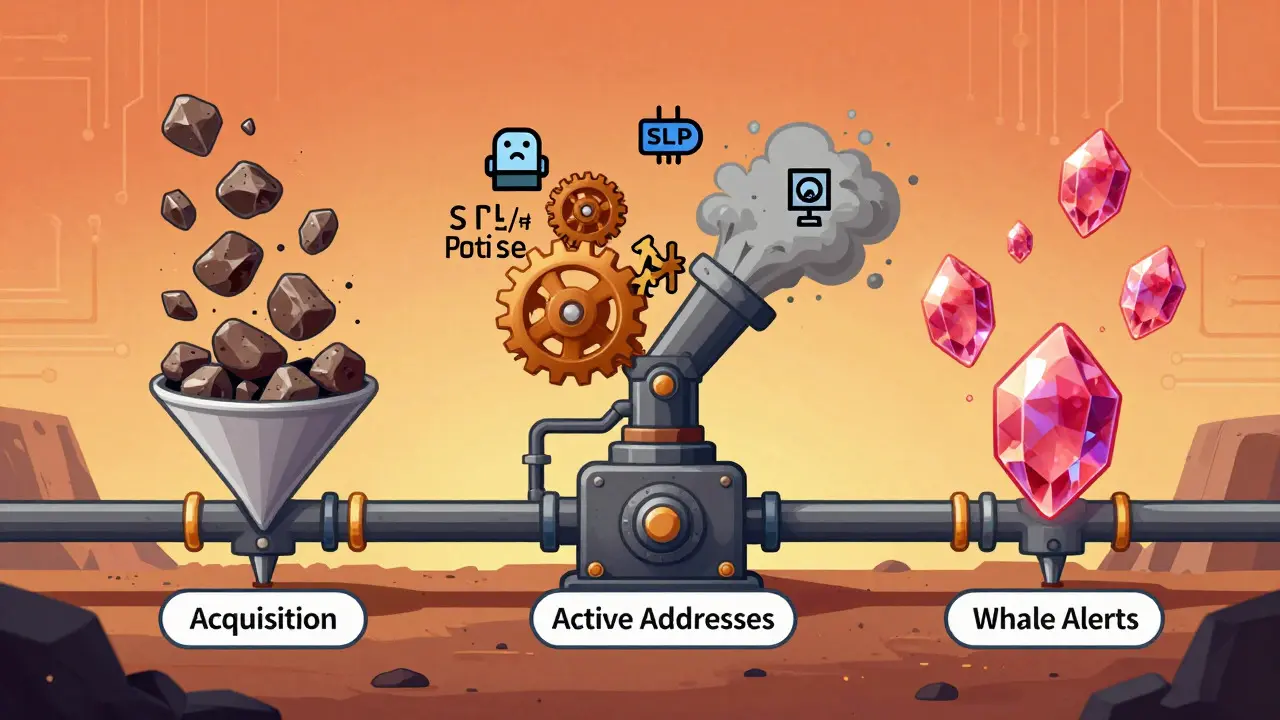
Mining on-chain data requires more than just looking at a block explorer. You need a pipeline that moves data from acquisition to processing and finally to interpretation. Here is the standard workflow used by professional analysts:
- Data Acquisition: You start by pulling raw data. For beginners, free tools like Etherscan or Blockchain.com explorers suffice for basic lookups. For deeper analysis, you use APIs provided by services like CryptoQuant or Glassnode. These APIs allow you to programmatically fetch large datasets, such as all transactions involving a specific address over the last year.
- Data Processing: Raw blockchain data is messy. It contains noise like miner revenue, exchange internal movements, and arbitrage bot activity. You need skills in SQL or Python to clean this data. For instance, filtering out transactions below a certain value or excluding known exchange hot wallets helps isolate "real" economic activity.
- Interpretation: This is where metrics come in. You apply formulas to the cleaned data to generate indicators like the Spent Output Profit Ratio (SOPR) or Market Value to Realized Value (MVRV). These metrics tell you whether holders are selling at a profit or a loss, providing insight into market sentiment.
The technical barrier has lowered significantly. Platforms like Dune Analytics now allow users to write SQL queries directly against indexed blockchain data without running their own nodes. However, for enterprise-level speed and historical depth, many teams still rely on specialized databases like Google BigQuery, which can cost upwards of $500 monthly for heavy usage.
Key Metrics Every Analyst Should Track
Not all on-chain metrics are created equal. Some are lagging indicators, while others offer leading signals. Here are the most critical ones to monitor in your analysis:
- Active Addresses: The number of unique addresses sending or receiving funds daily. A rising trend usually indicates growing network adoption and user engagement.
- Hash Rate / Staking Ratio: For PoW chains like Bitcoin, hash rate measures network security. For PoS chains like Ethereum, the staking ratio shows how much capital is locked up securing the network. High values suggest strong confidence in the protocol's future.
- Exchange Net Flow: Tracks the movement of assets between personal wallets and exchanges. Large inflows to exchanges often precede sell-offs, while outflows suggest long-term holding behavior.
- Whale Alerts: Monitoring transactions above a specific threshold (e.g., >$100,000). While not always predictive, sudden large movements can signal impending volatility or institutional accumulation.
- Gas Fees: Average transaction costs serve as a proxy for network demand. Spiking gas fees indicate high congestion, often driven by new token launches or DeFi activity.
Context is king. A spike in active addresses means nothing if it is driven by low-value spam transactions. Always cross-reference multiple metrics to confirm a narrative. For example, rising active addresses combined with increasing average transaction size suggests genuine organic growth.
On-Chain vs. Off-Chain: Why the Distinction Matters
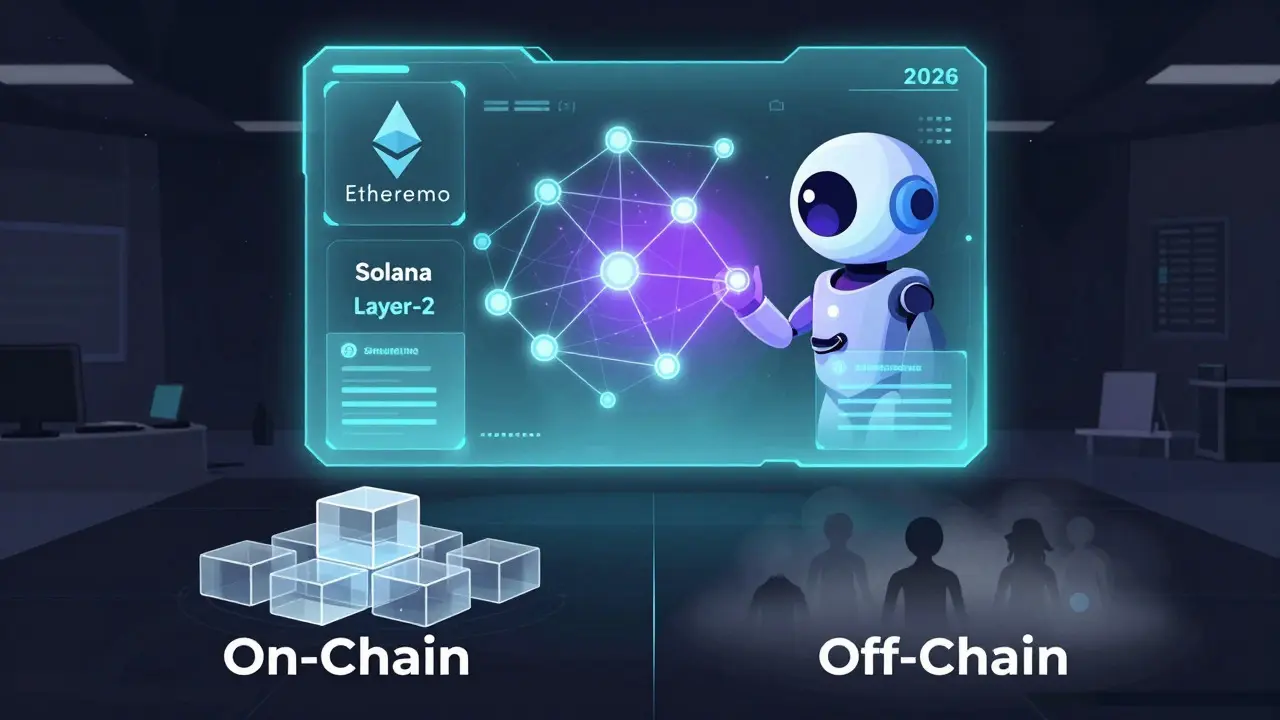
A common mistake among newcomers is treating all crypto data as equal. It is vital to distinguish between on-chain and off-chain activity. Off-chain data includes transactions that occur outside the main blockchain, such as trades on centralized exchanges (CEXs) or layer-2 scaling solutions.
| Feature | On-Chain Data | Off-Chain Data |
|---|---|---|
| Transparency | Fully public and verifiable | Opaque; controlled by private entities |
| Latency | Real-time (block confirmation time) | Near-instantaneous (internal database updates) |
| Cost | Requires gas/network fees | Often free or low-cost internally |
| Accuracy | d>99.998% for tracked wallet movementsVariable; depends on exchange reporting | |
| Use Case | Fundamental analysis, security auditing | Price action, short-term trading volume |
For instance, during periods of high market volatility, most trading volume shifts to centralized exchanges. If you only look at on-chain volume, you might mistakenly conclude that network activity is dropping. In reality, users are just trading faster and cheaper off-chain. Smart analysts combine both datasets to get a complete picture of market dynamics.
Common Pitfalls and How to Avoid Them
Even experienced analysts fall into traps when interpreting on-chain data. Here are the most frequent errors and how to sidestep them:
The "Whale" Fallacy: Not all large transactions are significant. Many "whale" alerts are actually internal exchange movements or rebalancing by market makers. According to user feedback, up to 62% of tracked large transactions are false positives. To avoid this, use labeled wallet databases from providers like Nansen, which categorize addresses as exchanges, protocols, or individuals.
Ignoring Bot Activity: Automated scripts and arbitrage bots can generate massive volumes of transactions. In Q1 2023, nearly 43% of Ethereum activity came from bots rather than human users. Filtering out known bot addresses is essential to measure true user interest.
Overlooking Privacy Coins: Chains like Monero or Zcash are designed to obscure transaction details. Only about 1.7% of Monero transaction data is analyzable. Do not apply standard on-chain metrics to privacy-focused networks; they will yield misleading results.
Confirmation Bias: It is easy to cherry-pick metrics that support your existing thesis. If you think Bitcoin is going up, you might focus solely on rising exchange outflows while ignoring declining hash rate. Always test your hypothesis against contradictory data points.
The Future of On-Chain Analysis in 2026 and Beyond
The landscape of blockchain analytics is evolving rapidly. As we move through 2026, several trends are reshaping how we mine and use this data:
AI-Enhanced Interpretation: Machine learning models are now being integrated into analytics platforms to reduce noise and identify patterns humans miss. Tools like Nansen’s Smart Alerts use AI to classify transactions, reducing false positives by over 30%. This automation makes advanced analysis accessible to non-technical users.
Cross-Chain Analytics: With the rise of interoperability protocols, assets move seamlessly across multiple blockchains. Traditional single-chain analysis is becoming obsolete. New platforms are building unified dashboards that track asset flows across Ethereum, Solana, Polygon, and Layer-2 networks simultaneously.
Regulatory Integration: Governments are increasingly requiring on-chain monitoring for compliance. The EU’s MiCA framework mandates stablecoin issuers to maintain robust transaction monitoring systems. This regulatory pressure is driving enterprise adoption, with major banks and hedge funds investing heavily in analytics infrastructure.
Privacy-Preserving Analytics: As privacy features improve, analysts are developing techniques to derive insights without compromising user anonymity. Zero-knowledge proofs are enabling new forms of verification that prove a statement is true without revealing the underlying data.
While challenges remain-such as scaling analysis for high-throughput chains and adapting to new privacy standards-the foundational value of on-chain data remains unchanged. The blockchain’s immutable nature ensures that as long as transactions occur, there will be a record to analyze. Mastering this skill set positions you ahead of the curve in the digital asset economy.
What is the best free tool for on-chain analysis?
For beginners, Etherscan (for Ethereum) and Blockchain.com Explorer (for Bitcoin) are the best starting points. They offer free access to basic transaction histories, address balances, and token transfers. For more advanced but still free options, Dune Analytics allows you to create custom dashboards using SQL, though it requires some technical knowledge.
How accurate is on-chain data compared to exchange data?
On-chain data is highly accurate for tracking actual asset movements on the blockchain, with studies showing 99.998% accuracy in identifying large wallet transfers. However, it does not capture off-chain activities like centralized exchange trading volumes, which can be inflated or opaque. Combining both sources provides the most comprehensive view.
Do I need coding skills to perform on-chain analysis?
Basic analysis can be done without coding by using visual platforms like Glassnode or Nansen. However, for custom queries, deep historical analysis, or automating workflows, proficiency in SQL and Python is highly recommended. These skills allow you to filter noise and extract specific datasets efficiently.
Can on-chain analysis predict price movements?
On-chain metrics can provide leading indicators of potential price movements, such as exchange inflows signaling selling pressure or rising active addresses indicating growing demand. However, they are not crystal balls. External factors like macroeconomic news and regulatory changes also drive prices. Use on-chain data as one piece of a broader analytical puzzle.
What are the biggest limitations of on-chain data?
Major limitations include data latency during network congestion, difficulty in distinguishing between human and bot activity, and the inability to fully analyze privacy-focused coins like Monero. Additionally, raw data requires significant processing power and expertise to interpret correctly, making it prone to misinterpretation by novices.

Comments
Stephanie Millar
Oh, my stars! This is absolutely fascinating stuff.!! I have always been intrigued by the sheer transparency of blockchain technology, and this guide really illuminates the path for those of us who are not quite tech wizards.!! The analogy of the public chalkboard in the bank is simply brilliant.!! It makes such a complex concept feel so accessible and grounded in reality.!! I particularly appreciated the section on distinguishing between on-chain and off-chain data; it clarifies so much confusion that plagues our community.!!
Ami Elizabeth
pretty solid breakdown tbh i usually just look at price charts but seeing how all these metrics like hash rate and active addresses actually correlate with network health is kinda wild. definitely gonna try dune analytics next week.
Walker Perry
they want you to believe this data is transparent but its all rigged by the central banks using backdoors in the code. the miCA framework is just a trojan horse for total surveillance. dont trust the labels on nansen they are fed to you by the same institutions manipulating the market. wake up sheeple.
Kiran Jayaram
this is basic stuff anyone with half a brain should know already. why are we still explaining uTXO models in 2026? pathetic. if you cant write sql queries yourself you are just a leech sucking on the teat of retail hype. stop buying sh*t coins based on whale alerts because most of them are just market makers washing volume to dump on your head. get educated or get rekt.
Zothana Pachuau
oh look another genius telling everyone else they are stupid. typical. maybe if you spent less time typing angry paragraphs and more time helping newbies understand why gas fees spike we would all be better off. sarcasm aside the point about filtering bot activity is crucial though. bots do move mountains of volume.
Kiran Jayaram
spare me the moral high ground coach. i see right through your supportive facade. you think helping noobs is noble? noob capital is what bleeds markets dry. let them fail. survival of the fittest applies here too. unlike you i care about results not feelings.
Linda Leeuwesteijn
Love this deep dive! 😍 It’s so true that raw data means nothing without context. I’ve been using Dune Analytics for a while now and it’s amazing how much you can learn just by looking at smart contract interactions. 📊 Don’t forget to check out the SOPR metric-it’s a game changer for understanding sentiment! 💪🚀
Susan Kiley
:) Oh, please. How utterly quaint. You think writing SQL queries makes you an analyst? How adorable. The real elites don't need tools; they have intuition and insider connections that no amount of 'on-chain' scraping can replicate. But by all means, keep playing with your little dashboards while the whales laugh all the way to the bank. :) Truly inspiring display of mediocrity.
Sarah Campbell
USA first baby! We built the internet and we will build the crypto future! 🇺🇸 All these foreign chains trying to steal our thunder with their weird consensus mechanisms. Ethereum is king because American innovation drives it. If you aren't tracking US-based wallets you are doing it wrong. Keep the patriots trading! 🦅💰
manish jha
The moral decay of society is evident in how casually we discuss financial speculation as if it were a sport. These 'whales' are merely symptoms of a deeper spiritual void. True value lies in service and community, not in hoarding digital tokens behind encrypted walls. One must ask: does this bring peace to the world?
Ashley Snyder
i totally agree with the part about confirmation bias. its so easy to just look for data that supports what you already want to believe. i caught myself doing that last month when i was bullish on solana. ended up losing some cash because i ignored the exchange inflows. good reminder to stay objective!
Nia Franklin
Gosh, this is like a treasure map for nerds!,, I love how it breaks down the messy bits into something manageable.!! The bit about privacy coins being hard to analyze is spot on; Monero is basically a black box to me.!! I’m going to start watching gas fees more closely because they really do tell a story about network congestion.!! Thanks for sharing this gem!!
Lance Konig
It is precisely this kind of oversimplification that leads to catastrophic losses. The article suggests that active addresses indicate adoption, yet fails to mention that sybil attacks can artificially inflate these numbers. A single entity can control thousands of addresses. Therefore, relying on such metrics without rigorous de-duplication is statistically negligent. One must approach this data with extreme skepticism.
Shawn Schaerer
Indeed, Mr. Konig raises a valid point regarding sybil attacks. However, one must consider the economic cost of generating such vast amounts of fake activity. Is it truly rational to expend such resources merely to skew metrics? Perhaps the article should have elaborated on the distinction between organic growth and artificial inflation. Nevertheless, the foundational principles remain sound.
Lance Konig
Rationality is often absent in speculative markets. The cost is negligible compared to the potential gains from pumping a token. Do not mistake greed for logic. Your defense of the article’s simplicity is commendable but ultimately futile against the machinations of sophisticated actors.
Phelan Deihl
I tend to keep to myself mostly, but this section on AI-enhanced interpretation really resonated with me. It feels like the tools are finally catching up to the complexity of the data. Maybe soon we won't have to spend hours cleaning datasets manually.
Sarah Hafner
Thanks for the comprehensive guide! :) I found the comparison table between on-chain and off-chain data particularly helpful. It’s easy to get confused when prices move but on-chain volume looks flat. Now I understand it’s likely happening on CEXs. Keep up the great work! :)
michelle aguilar
How tedious. Another long-winded explanation of something that should be intuitive to anyone with a modicum of intelligence. Over-punctuating your sentences doesn’t make your analysis deeper, Stephanie. And frankly, the reliance on third-party APIs is a crutch for those too lazy to run their own nodes. Disappointing level of discourse here.
Stephanie Millar
Well, hello there, Michelle.!! Running a full node is certainly impressive, but isn't the goal of this community to share knowledge and make it accessible?!! Not everyone has the bandwidth or hardware to dedicate to running a node 24/7.!! Using APIs allows for broader participation and democratizes access to insights.!! Let's try to be a bit more inclusive, shall we?!!
alex fordy
Great points everyone! 🌟 I think the key takeaway is that no single metric tells the whole story. Combining on-chain data with macro trends seems like the smartest approach. Also, thanks for the tip on Nansen for filtering out false positives-definitely worth checking out. Happy analyzing! 👍😊
Dina Lazarova
This article is hardly groundbreaking. It reads like a marketing brochure for Glassnode. The suggestion that one needs only SQL and Python to become an expert is laughably naive. True expertise requires years of experience and an innate understanding of market psychology, which cannot be taught via a blog post. Mediocre effort.